Introducing Alive
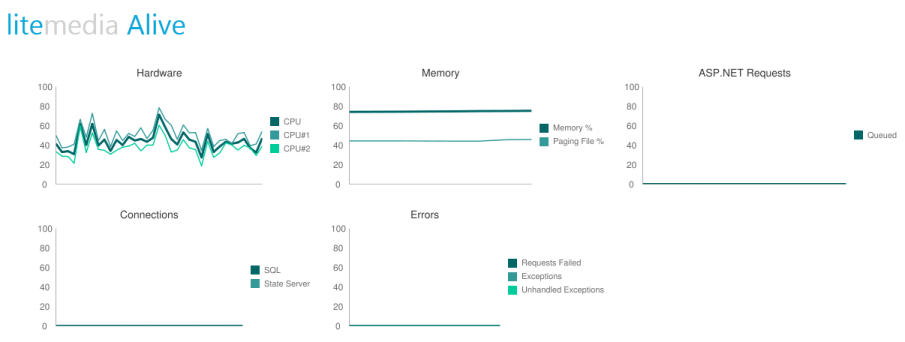
Alive is a performance counter monitor for ASP.NET. You install it in an IIS application and can view it from anywhere. It's free, it's open source and it's happy pappy.

Prerequesits
Alive should work on any of the following.
- IIS 6.0, IIS 7.0, IIS 7.5 and IIS Express
- CLR 2.0, CLR 4
- Web browser client: Firefox, Chrome (not IE)
Installation
There are several ways to install Alive described below. After the installation you should go to the Alive url.
- http://yoursite/Alive.axd/
Project NuGet Installation
The NuGet package is designed to work well with Cassini, the build debug webserver in Visual Studio. That is why the NuGet package version is compiled for x86. This will probably not work well on your server, as most servers today is x64, but it was a design decision based on most developers are using Cassini as their primary web server during development.
Install-Package LiteMediaAlive
Server installation
Go download the appropriate package from
The architecture x86/x64 has to match your server, and CLR version must match the application pool.
- Copy Alive.dll into your bin directory.
Alive works through an HttpHandler. This means that you need to add a reference to the handler in your web.config.
IIS 6.0
IIS 7.0+
Authorize your web application user to read performance counters
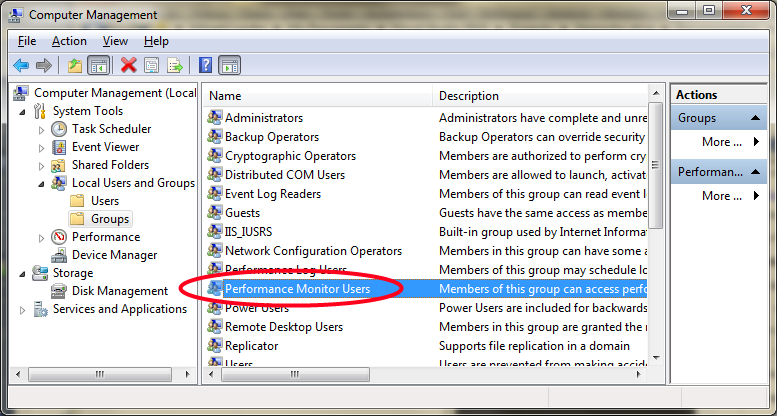
Before Alive can read performance counters off your system you need to grant it access. This means that
- You need to run your application pool as a custom user
- You need to add that user to the group "Performance Monitor Users" on the local machine.

Installation scripts will be added to the project when I got the time.
Configuration
Different installations of Windows might have different performance counters. Here's a default configuration to start from.
<alive> <settings columns="3" /> <counters> <groups> <group name="Hardware" updateLatency="1000"> <counter name="CPU" categoryName="Processor" counterName="% Processor Time" instanceName="Total" /> <counter name="Memory" categoryName="Memory" counterName="Pages/sec" /> </group> <group name="Memory" updateLatency="5000"> <counter name="RAM" categoryName="Memory" counterName="% Committed Bytes In Use" /> <counter name="Page file" categoryName="Paging File" counterName="% Usage" instanceName="Total" /> </group> <group name="ASP.NET Performance" updateLatency="1000"> <counter name="Queued req." categoryName="ASP.NET" counterName="Requests Queued" /> <counter name="Rejected req." categoryName="ASP.NET" counterName="Requests Rejected" /> <counter name="Requests/sec" categoryName="ASP.NET Applications" counterName="Requests/Sec" instanceName="Total" /> </group> <group name="IIS" updateLatency="5000"> <counter name="App Restarts" categoryName="ASP.NET" counterName="Application Restarts" /> <counter name="Recycles" categoryName="ASP.NET" counterName="Worker Process Restarts" /> </group> <group name="Errors" updateLatency="5000"> <counter name="ASP.NET" categoryName="ASP.NET Applications" counterName="Errors Total" instanceName="Total" /> </group> <group name="Session state server" updateLatency="5000"> <counter name="Active" categoryName="ASP.NET" counterName="State Server Sessions Active" /> </group> </groups> </counters> </alive> </configuration>
Every group element is a chart. You can place several counters in each chart. You specify the counters with the following attributes
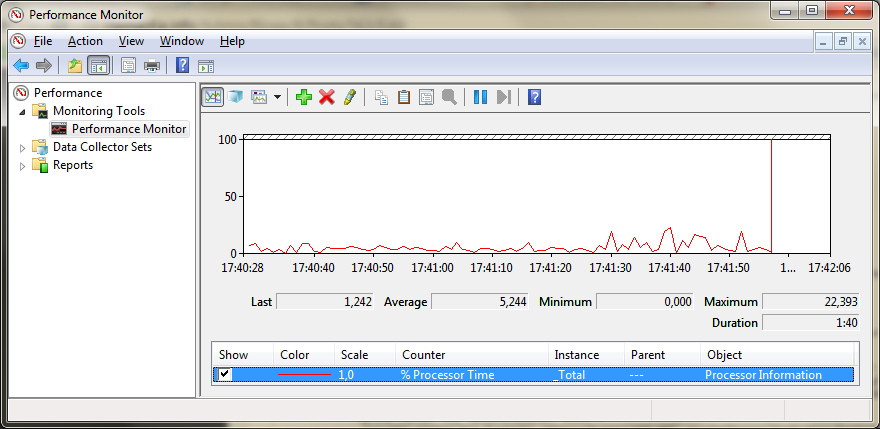
name= name of the counter in the chartcategoryName= name of the performance counter category, called "Object" in the image belowcounterName= name of the performance counter, called "Counter" in the image below- (optional)
instanceName= name of the specific instance of this counter, called "Instance" in the image below
Easiest way to find performance counters is through the performance monitor in Windows. Just type "perfmon" in Start/Run and you will get the following interface.

Troubleshooting
Most common problem is that no counters are showing. When that happens, open up perfmon on the servern and verify that the counters aren't actually zero on the server. Now, this problem might relate to any of the following
- You're not running under full trust. Performance counters won't work under medium trust, period.
- Your IIS application pool identity is not a member of group "Performance Monitor Users" on the local machine.
- Your machine architecture x86/x64 does not match the compiled DLL Alive.dll. Exchange it with the correct one from here
http://code.google.com/p/litemedia-alive/downloads/list
If you've verified all these, you need to turn on application logging.
Copy Common.Logging.dll, Common.Logging.Log4Net.dll and Log4Net.dll to your bin directory. Edit your web.config with the following additions.
<common> <logging> <factoryAdapter type="Common.Logging.Log4Net.Log4NetLoggerFactoryAdapter, Common.Logging.Log4net"> <arg key="configType" value="INLINE" /> </factoryAdapter> </logging> </common>
<log4net> <appender name="LogFileAppender" type="log4net.Appender.RollingFileAppender"> <file value="logs\log.txt" /> <appendToFile value="true" /> <rollingStyle value="Size" /> <maximumFileSize value="1MB" /> <maxSizeRollBackups value="10" /> <layout type="log4net.Layout.PatternLayout"> <conversionPattern value="%date %-5level %logger - %message%newline" /> </layout> </appender>
<appender name="AuditFileAppender" type="log4net.Appender.RollingFileAppender">
  <file value="logs\activity.txt" />
  <appendToFile value="true" />
  <rollingStyle value="Size" />
  <maximumFileSize value="1MB" />
  <maxSizeRollBackups value="10" />
  <layout type="log4net.Layout.PatternLayout">
    <conversionPattern value="%date %-5level %logger - %message%newline" />
  </layout>
</appender>

<logger name="alive-debug">
  <level value="ALL" />
  <appender-ref ref="LogFileAppender" />
</logger>
<logger name="alive-activity">
  <level value="ALL" />
  <appender-ref ref="AuditFileAppender" />
</logger>
</log4net> </configuration>
Credits
Alive is open source1 hosted on Google Code. It was created by me, Mikael Lundin, and written in F# server side and CoffeScript on the client. Comments and bug reports are more than welcome.
Footnotes