
Using the Toggl API continued...
This is a follow up on my previous post where I showed you how to connect to Toggl API with .NET and extract registered tasks.
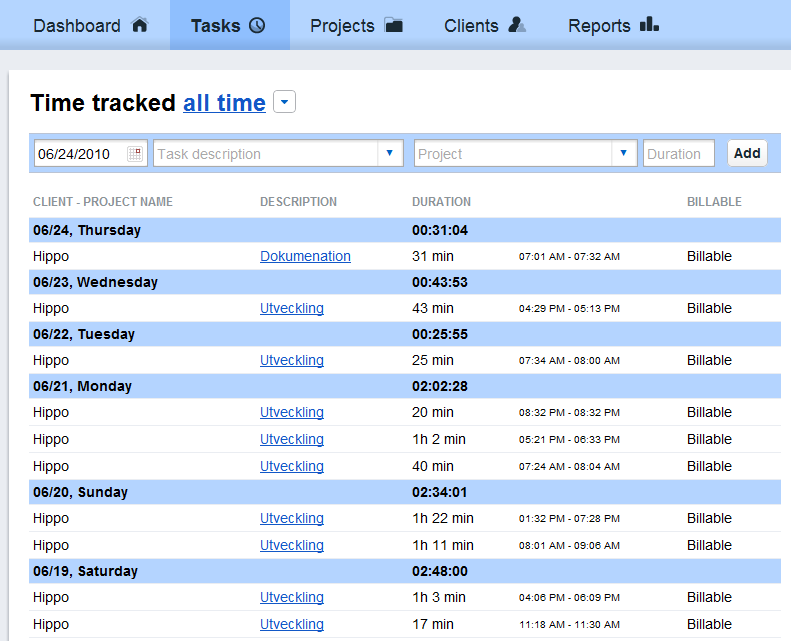
If we take that data and devide it into weeks, we could plot the amount of work spent each week in a chart with a library like ZedGraph.
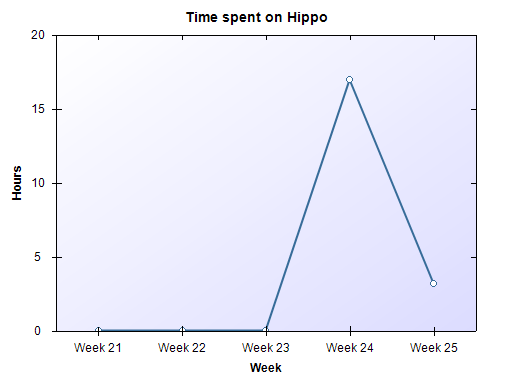
As you can see, I started to register my time last week and this week is not finished. By scheduling this chart generation and make sure that the output image is available from an external URL, I can place a chart that displays my activity on the CodePlex dashboard. I usually look at the commits to see if the project is active, but this would also be a perfect tool. It gives the visitor a hunch how much time was spent during the last five weeks on this project.
comments powered by Disqus