
TogglChart
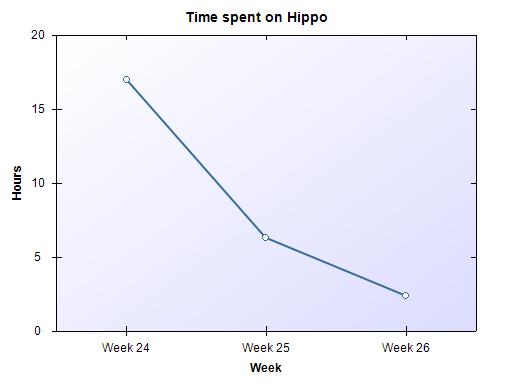
I've studied before how to connect to the Toggl API both here and here. Toggl is a tool for easily tracking time put in a project. This is necessary for billing customers, but also useful for tracking your own effort to a project. I've written a command line tool that will extract data from Toggl API and create a chart that will show amount of hours spent per week. A chart can look like this.
All you need to do, is to call the executable with your API Token as required argument.
TogglChart.exe -apiToken=ec3223d0919b45ec2267826fc0954db0
There are some posibilities to customize the output. Here's the full usage for this command line tool.
      --apiToken=VALUE       Your API token from Toggl. Easily find in "My
                             settings" https://www.toggl.com/user/edit
      --imageWidth=VALUE     Width of the result chart in pixels (image will
                             scale to fit width)
      --imageHeight=VALUE    Height of the result chart in pixels (image will
                             scale to fit height)
      --imageTitle=VALUE     The main title of the chart that will be shown
                             at the top.
      --outputFile=VALUE     Path and filename to the output file. Example:
                             toggle.jpg
      --imageFormat=VALUE    Filetype of the result image. Legal values are
                               jpg, png, bmp and gif
      --weeks=VALUE          Number of weeks backwards that tasks should be
                             fetched from Toggl.
      --projectName=VALUE    The name of the project in Toggl. This is useful
                             to specify when you have several different
                             projects that you register time on and only want

                             to create chart for one of them. If you don't
                             specify project name, chart will be created from

                             all projects combined.
      --dynamic              If you set this value to true, empty weeks at
                             beginning of the period will be removed.
      --help, -h, -?         Displays this message.
MsBuild Task
I've also included an MSBuild task. Instead of using the TogglChart.exe directly you can call the MSBuild task inside the TogglChart.dll.
<Target Name="TogglChart"> <TogglChart ApiToken="ec3223d0919b45ec2259296fc0954db0" ImageWidth="320" ImageHeight="240" ImageTitle="Time spent on Hippo" OutputFile="$(ArtifactDirectory)\togglchart.jpg" ImageFormat="jpg" Weeks="10" ProjectName="Hippo" Dynamic="true" /> </Target>
Both TogglChart.exe and TogglChart.dll are stand-alone. You do not need the DLL for the EXE to run, nor the other way around.
Download
License: You are free to use and distribute this application.